The Power of Parameterized Reports With Plumber
Contents
Hello! It’s been… a while, to say the least. But I wanted to share a new thing I’ve been working on. Specifically, I’ve finally started to move more toward the “R in production” model, and I wanted to share how freaking fantastically awesome the combination of parameterized reports in R Markdown with plumber can be.
TL;DR
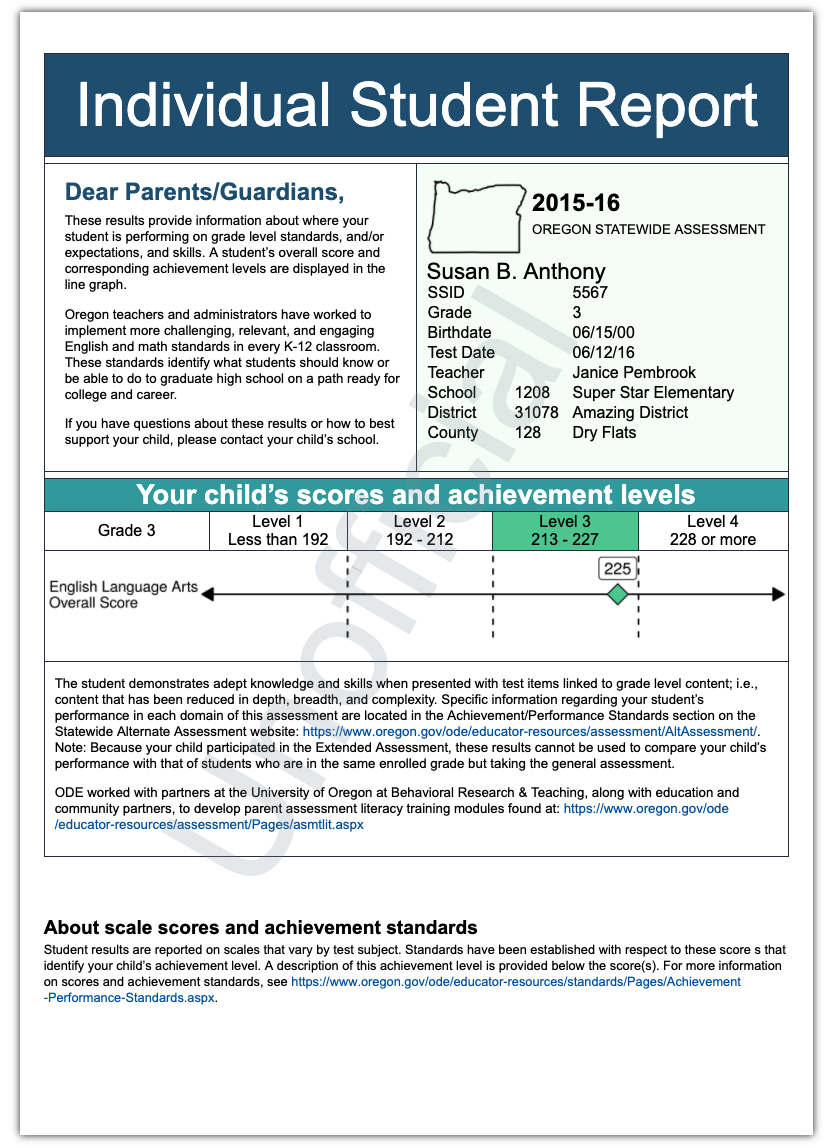
I created the report below using pagedown with some (rather a lot of) custom CSS. It’s a parameterized report so passing additional arguments to rmarkdown::render() changes how the actual report is produced. I then used plumber to build an API so we can produce any report programmatically. Then, we use docker to create an image of the whole thing, and that gets sent to our programmer who links it without our live database and, et voilà! Individual student reports generated on the fly, as soon as the data come in. Wild.
In this post, I’m only going to cover the parameterized report and plumber combination. I’ll save the docker part for a different post. I also won’t dig into the CSS really at all, but I can cover some of that in a separate post as well if there’s interest. You can see the full source code, including all components, here.
Parameterized pagedown reports
The basics of parameterized reports is pretty straightforward (see here for a quick overview). Basically, you add the params argument to your YAML, and then include as many arguments as you want. These are the arguments that will change how the report is produced (you can think of it as different sources of data for the report).
In the case of the individual student report, there are a lot of parameters, including the year, student name, grade, birth date, test date, school, district, and of course their actual score (among others). The full YAML of the pagedown report looks like this
---
title: "Individual Student Report"
date: "`r Sys.Date()`"
output:
  pagedown::html_paged:
    self_contained: true
    css: [score-report-style.css]
    number_sections: false
    fig_caption: false
links-to-footnotes: false
fig_caption: false
params:
  ssid: 9878654321.0
  year: "2018-19"
  name: "Susan B. Anthony"
  grade: 5
  content: "Science"
  birthdate: "9/1/2002"
  testdate: "3/13/2019"
  teacher: "Daniel Anderson"
  school_id: 1234
  school_name: "Apple High School"
  district_id: 5678
  district_name: "Cherry SD"
  county_id: 99
  county_name: "Grape"
  score: 510.0
---
Notice that for now I just have a bunch of placeholders for each of these arguments. After specifying the params, they are available within the R Markdown document itself. For example, the demographic table in the light green box is produced with the following code
stu_data <- data.frame(
  var = c("SSID", "Grade", "Birthdate", "Test Date",
          "Teacher", "School", "District", "County"),
  id = c(rep(NA_integer_, 5),
         params$school_id, params$district_id, params$county_id),
  values = with(params,
                c(ssid, grade, birthdate, testdate,
                  teacher, school_name, district_name, county_name)
            )
)

options(knitr.kable.NA = '')
knitr::kable(stu_data)
In other words, I’m creating a table where all of the information comes from the parameters. One thing I found particularly helpful here, was that there’s actually a params object right in your local interactive R session if you click the “Run All Chunks Above” button.
In the case of this particular report, we use the params for just about everything, including changing the descriptive text describing the student’s score. The point on the line graph is just a ggplot2 plot, and it’s created from the params$score data.
Rendering
The real power of parameterized reports, however, comes during rendering. As I stated above, the params in the YAML are really just a placeholder. You can swap those values for any other values as you render the document, and a new document will be created based on those values. For example, we could do something like this
  rmarkdown::render(
    'score-report.Rmd', # the file we want to render
    params = list(      # the parameters we want it rendered with
      ssid = 1234,
      year = "1827-28",
      name = "Frederick Douglass",
      grade = 5,
      content = "Math",
      birthdate = "02/14/1817",
      testdate = "05/15/1828",
      teacher = "Anna Murray",
      school_id = 5689,
      school_name = "Eastern Shore",
      district_id = 9201,
      district_name = "Chesapeake Bay",
      county_id = 5531,
      county_name = "Talbot",
      score = 245
    )
  )
This would create a report specific to Frederick Douglass. Given this structure, we could pretty easily extend it to loop through all our data and generate the report for each student. But remember, the goal was to make this part of an operational system where the reports can be generated on the fly. So instead of looping through existing data, we’ll create an API where we can generate the report with any data.
API Creation
You can see the basics of creating an API with the plumber package here. It’s really not terrifically different from writing a standard R function. The difference is really just that (a) you don’t bind the function to a name (no assignment), and (b) You use specialized comments (very similar to roxygen2 for package development) to both document the API and tell it how to behave. Our rendering function looks basically like this, when creating an API for the function via plumber
#* Generate a student report for the ORExt
#* @param ssid The statewide student identifier. Should be numeric.
#* @param year The year of the test. Should be in the form YYYY-YY
#* @param name Student's name (first and last)
#* @param content The test content area. Should be one of "ELA", "Math", or "Science"
#* @param birth_date The student's birth date.
# ... # additional @param descriptions omitted
#* @serializer html
#* @get /report

function(ssid, year, name, grade, content, birth_date, test_date,
         teacher_name, schid, sch_name, distid, dist_name, countyid,
         county_name, score) {

  rmarkdown::render(
    'score-report.Rmd',
    params = list(
      ssid = ssid,
      year = year,
      name = name,
      grade = grade,
      content = content,
      birthdate = birth_date,
      testdate = test_date,
      teacher = teacher_name,
      school_id = schid,
      school_name = sch_name,
      district_id = distid,
      district_name = dist_name,
      county_id = countyid,
      county_name = county_name,
      score = score
    )
  )
}
All of the #* @param arguments provide documentation for the function arguments. The @serializer part provides the return type (e.g., it could be a plot or text or whatever), and the @get /report part specifies specifies that the API will accept GET requests for /report. However, this is not quite the full story. If you were to create an API similar to the one above, it would return an HTML file that you could download, but that’s not really what we want. We want just the actual HTML in return. To do that, we include one additional line
readBin(outfile, "raw", n = file.info(outfile)$size)
where outfile is the rendered report. This then returns the actual HTML file, rather than a file to download (see another example here).
The full API setup then looks like this
#* Generate a student report for the ORExt
#* @param ssid The statewide student identifier. Should be numeric.
#* @param year The year of the test. Should be in the form YYYY-YY
#* @param name Student's name (first and last)
#* @param content The test content area. Should be one of "ELA", "Math", or "Science"
#* @param birth_date The student's birth date.
# ... # additional @param descriptions omitted
#* @serializer html
#* @get /report

function(ssid, year, name, grade, content, birth_date, test_date,
         teacher_name, schid, sch_name, distid, dist_name, countyid,
         county_name, score) {

  outfile <- paste0(ssid, '-', content, '.html') # name the outfile

  rmarkdown::render(
    'score-report.Rmd',
   output_file = outfile, # save it during rendering
    params = list(
      ssid = ssid,
      year = year,
      name = name,
      grade = grade,
      content = content,
      birthdate = birth_date,
      testdate = test_date,
      teacher = teacher_name,
      school_id = schid,
      school_name = sch_name,
      district_id = distid,
      district_name = dist_name,
      county_id = countyid,
      county_name = county_name,
      score = score
    )
  )

  #read the outfile and return it
  readBin(outfile, "raw", n = file.info(outfile)$size)
}
That’s basically it! Our API is now set up, and we can call it.
Calling the API
If you want to call the API locally, I recommend using a file structure like this
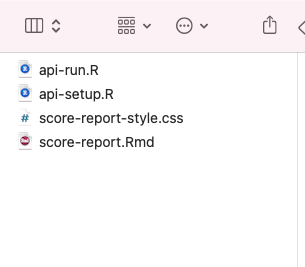
The API above is in the api-setup.R file, and score-report.Rmd is the pagedown parameterized report we want to render (which also needs score-report-style.css). The contents of the api-run.R file looks like this
library(plumber)

report <- plumb("api-setup.R")
report$run(port=80, host="0.0.0.0")
This says to create the API from the api-setup.R file, then run it on port 80. If you do this in RStudio, you’ll get something that looks like this
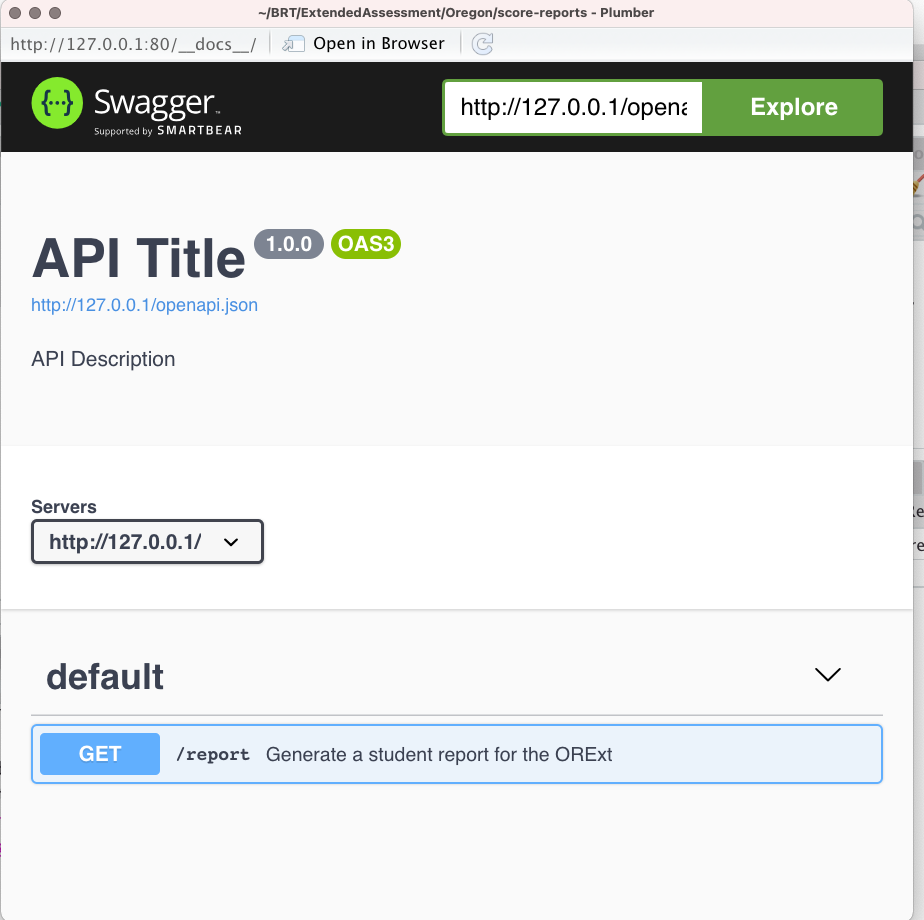
From here, click “Open in Browser” and you’ll see the same thing in your web browser. This is the documenation page, and if you click “report” (the thing we called our @get) you’ll see the actual documentation.
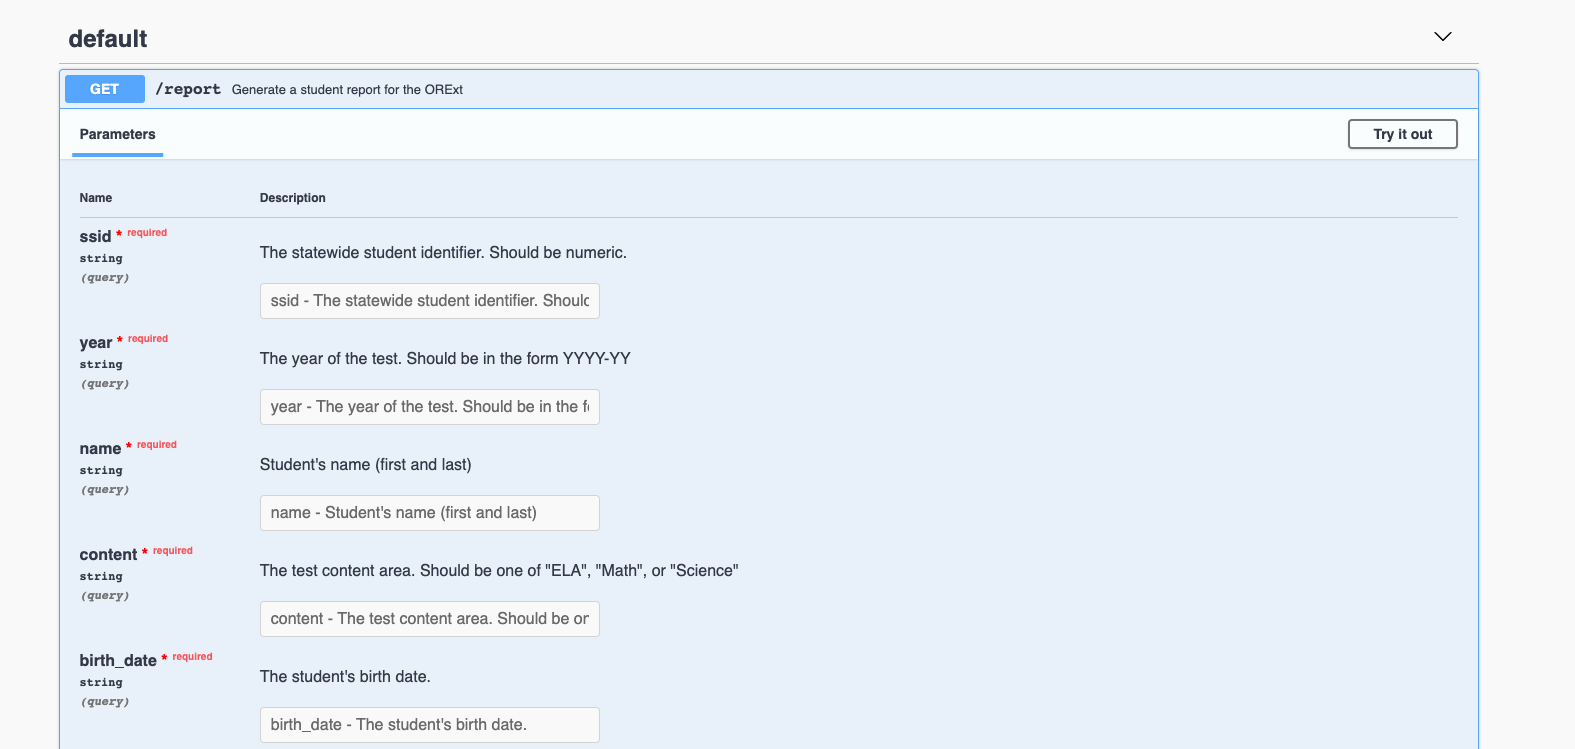
From there, you can click the “Try it out” button and enter specific values for the fields. It will provide you a link that you can visit, and you’ll see the report! For example, the report shown at the beginning of this post is available to me (after the API is running) at
http://127.0.0.1/report?ssid=5567&year=2015-16&name=Susan%20B.%20Anthony&content=ELA&birth_date=06%2F15%2F00&grade=3&test_date=06%2F12%2F16&teacher_name=Janice%20Pembrook&schid=1208&sch_name=Super%20Star%20Elementary&distid=31078&dist_name=Amazing%20District&countyid=128&county_name=Dry%20Flats&score=225
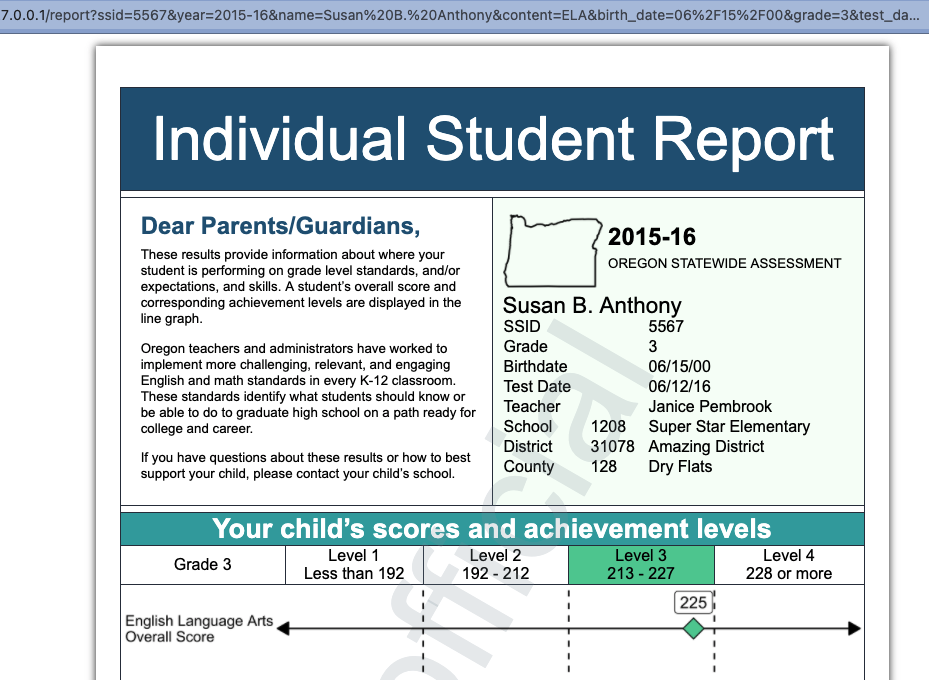
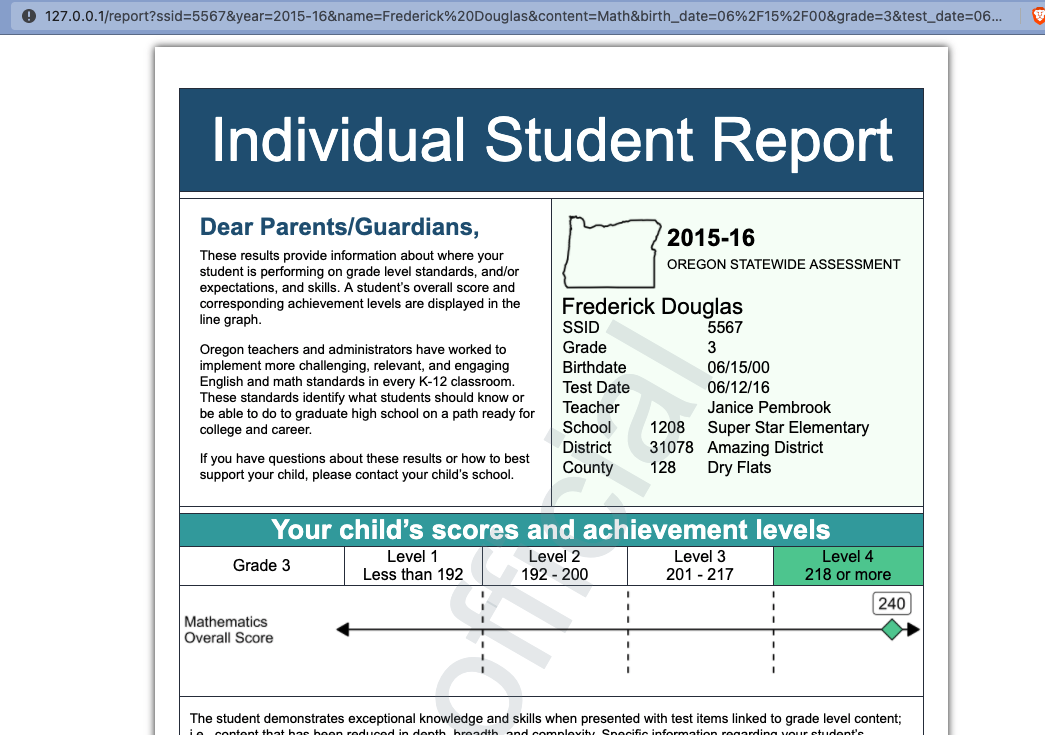
Notice we have http://127.0.0.1/report, which specifies we’re using our localhost and accessing the report from our API. What follows are all the arguments, where & separates each argument. Spaces are specified as %20, and otherwise everything is as you would expect. If you change a few of the arguments in your web browser, you’ll get a new report. For example, let’s just change the name, content, and score, with this address
http://127.0.0.1/report?ssid=5567&year=2015-16&name=Frederick%20Douglas&content=Math&birth_date=06%2F15%2F00&grade=3&test_date=06%2F12%2F16&teacher_name=Janice%20Pembrook&schid=1208&sch_name=Super%20Star%20Elementary&distid=31078&dist_name=Amazing%20District&countyid=128&county_name=Dry%20Flats&score=240
Then we get the following
Because we’re running this locally, it’s just using our local R session to actually render the reports. To make it more scaleable, we can use docker instead, which will allow us to install a specific version of R, plus all the packages we need, on a disk image which we can pass off to a hosting site (e.g., AWS, DigitalOcean) or to another programmer who can incorporate it into the production code base (in my case, the person in charge of our live database). But we’ll save the docker piece for a later post.
Author Daniel Anderson
LastMod 2021-09-29 (7e5cd38)