#whoami
- Research Assistant Professor: Behavioral Research and Teaching, University of Oregon (#goducks)
- Dad (two daughters: 6 (almost 7) and 4)
- Primary areas of interest
- 💗💗R💗💗 and computational research
- Open data, open science, and reproducible workflows
- Growth modeling, achievement gaps, and variance between educational institutions (particularly spatially)

#whoami 2
- Assistant Professor: STEM Education, University of Tennessee, Knoxville
- Also a Dad (one-year-old toddler!)
- Primary areas of interest
- Data science in education (network analytic methods, experience sampling method, computational grounded theory)
- Data science education (integrating data science and science education)

R Markdown
From within your R Studio Project:
First thing: Render!
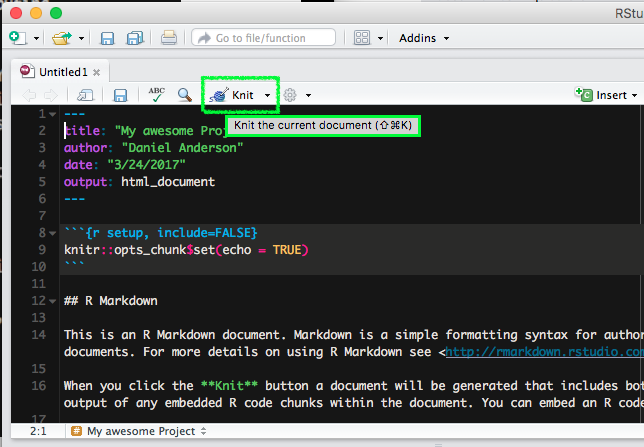
Create new a R Markdown doc
### Try it out!
YAML Front Matter
---title: Example Markdown documentauthor: - Daniel Anderson - : "2019-05-07"---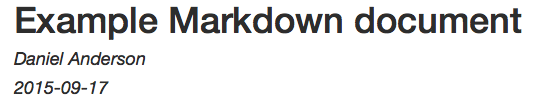
- Three dashes before and after the YAML fields
- Case sensitive
- Many other fields are possible.
- For example, you may want to include an
output:argument (pdf_document,html_document,word_document). Must be specified as it is rendered, if not supplied.
- For example, you may want to include an
Code chunks versus text
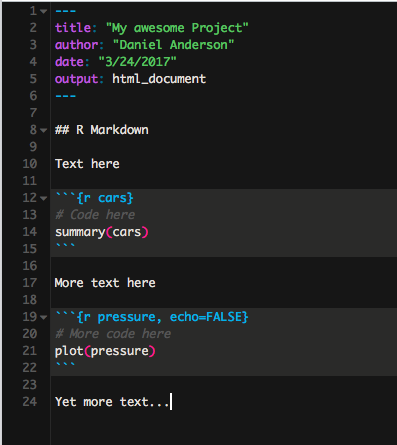
Code chunks
Start a code chunk with ```{r}, then produce some r code, then close the
chunk with three additional back ticks ``` .
Code chunks
Start a code chunk with ```{r}, then produce some r code, then close the
chunk with three additional back ticks ``` .
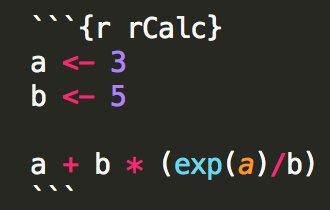
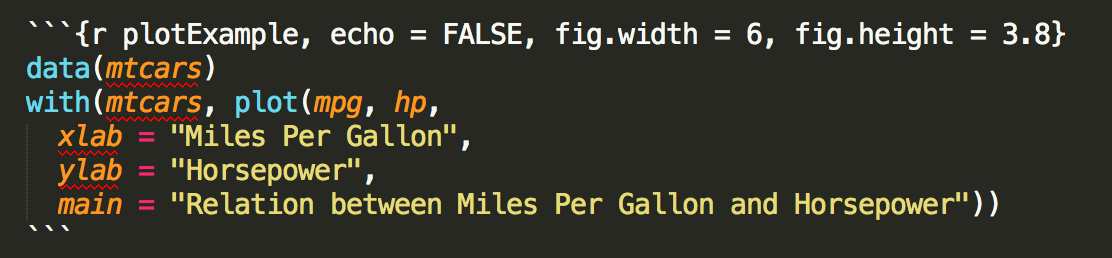
a <- 3b <- 5a + b * (exp(a)/b)## [1] 23.08554Headings and Lists
Not R-lists
# Level 1## Level 2 ### Level 3 (etc.) * Unordered list - inset + inset more - etc.1. Ordered list a. blah blah2. More stuff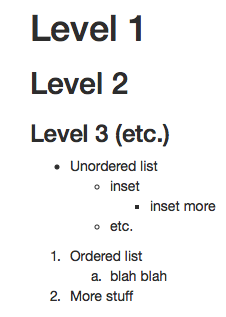
echo and eval
You can show code without evaluating it, using eval = FALSE.
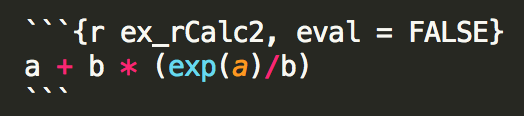
a + b * (exp(a)/b)Alternatively, you can evaluate the code without displaying it, using echo =
FALSE.

warning
Warning = FALSE
ggplot(msleep, aes(sleep_rem, sleep_total)) + geom_point() Warning is printed to the console when rendering.
Warning = TRUE
ggplot(msleep, aes(sleep_rem, sleep_total)) + geom_point()## Warning: Removed 22 rows containing missing values (geom_point).
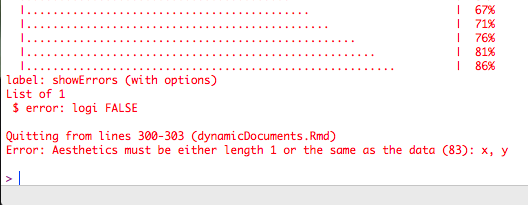
Show errors
error = TRUE
ggplot(msleep, aes(sleep, sleep_total)) + geom_point()## Error: Aesthetics must be either length 1 or the same as the data (83): xIf error = FALSE, the document won't render if it encounters an error.
Message
Some functions will return messages. You may want to suppress these.
message = FALSE
ggplot(msleep, aes(sleep_total)) + geom_histogram()
Message
message = TRUE
ggplot(msleep, aes(sleep_total)) + geom_histogram()## `stat_bin()` using `bins = 30`. Pick better value with `binwidth`.
include
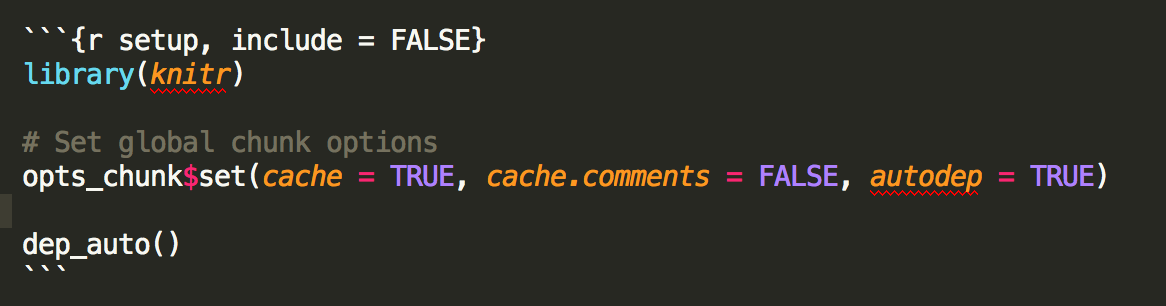
The include argument is used to evaluate code that is not included in the
document at all. For example, when setting up your global options.
Inline code
A single back tick followed by r produces inline code to be evaluated.

This is an example of inline code, where I want to refer to the sum of a and
b, which is 8.
This is extremely useful in writing reports. Never have to update any numbers in text, regardless of changes to your models or data (if you are careful about it).
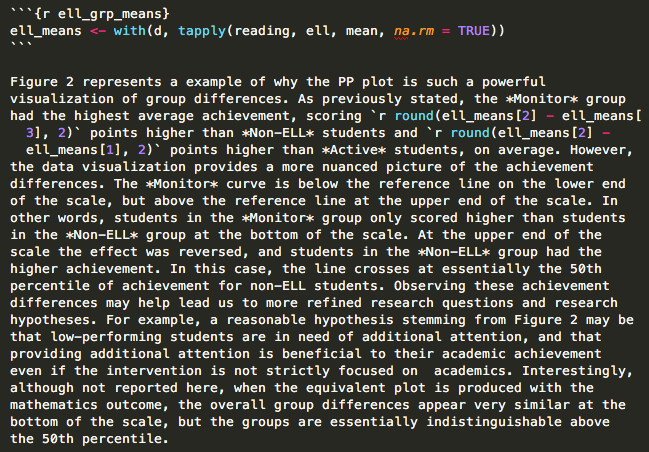
Real example